Both research and crop production benefit from simple, automated methods to monitor a variety of plant or crop parameters, such as leaf or canopy size, pigmentation, or early signs of biotic and/or abiotic stresses. The availability of low-cost cameras and microcomputers makes imaging a practical tool for a wide variety of applications. In the Horticultural Physiology Lab, we routinely use two different types of imaging, chlorophyll fluorescence imaging and multi-spectral imaging. Each has its own pros and cons.
Watch this seminar by Changhyeon Kim for an overview of our imaging work

Chlorophyll fluorescence imaging
has long been used in plant physiology research to monitor photosynthetic efficiency, specifically the quantum yield of photosystem II. Such equipment is expensive and hard to implement at a larger scale. Our approach uses a simplified version of chlorophyll fluorescence imaging. We expose plants to blue light and take images with a camera that blocks all but the red and far-red light. As a result, we can take pictures of the fluorescence coming from plants. The technique is both simple and cheap.
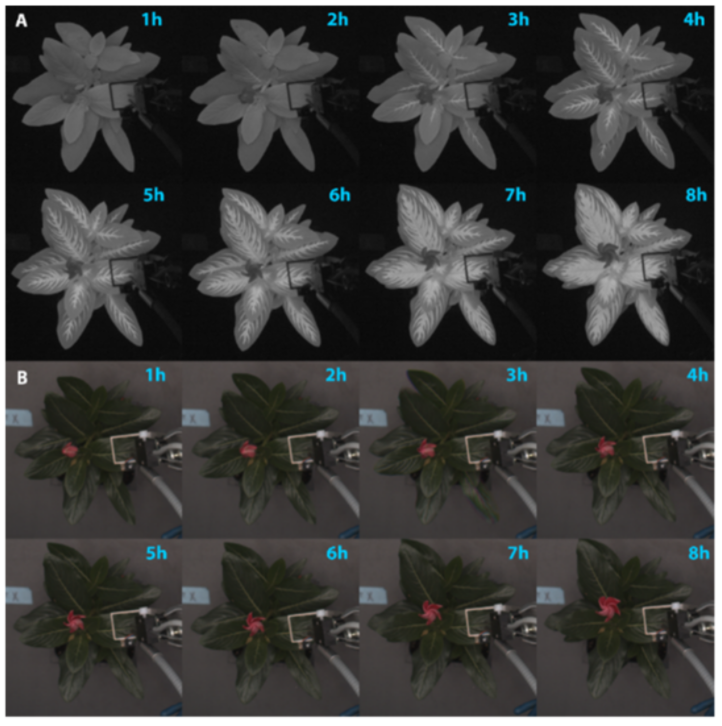
The time lapse images on the right show twice weekly images of a lettuce plant, The nice thing about chlorophyll fluorescence is that only the plant, not the background, is visible. This makes it easy to calculate canopy size and non-destructively monitor plant growth over time. The process is easily automated and data can be uploaded to the cloud automatically.
How does it work?
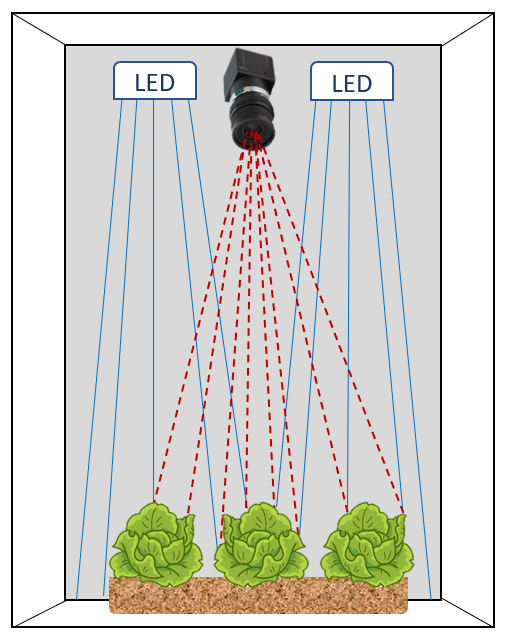
It really is simple. All photosynthetic organisms contain chlorophyll, which fluoresces. What that means is that a small fraction of the light that is absorbed by plants is given off again as red and far-red light. Yes, plants literally glow. We can’t see it, because the fluorescence is too weak, only 1 – 2% of the light that hits the plant. But it is easy to photograph.
We lit plants using blue LEDs and and than take a picture through a filter that allows only red and far-red light to pass through the lens to the image sensor. The result: an image of the light produced by the plant.
Because ambient light interferes with the imaging, these images have to be collected in the dark; either at night or inside a light-proof enclosure.
These systems are easy to build, using off the shelf components.
What do we use chlorophyll fluorescence imaging for?
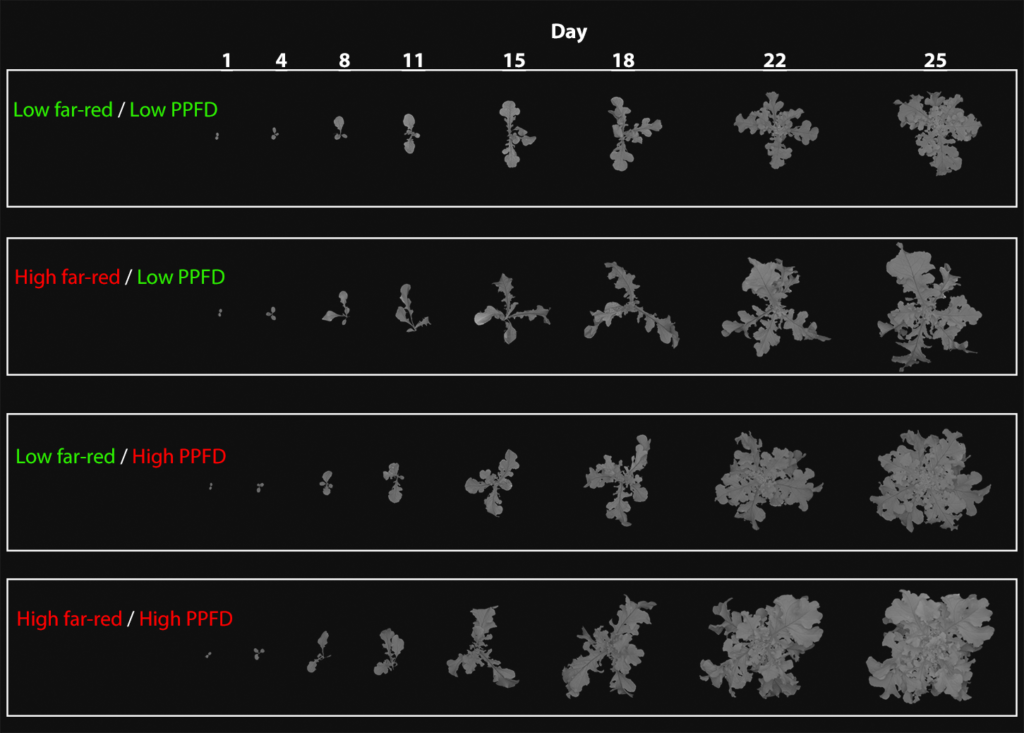
The simplest application is monitoring canopy size and to compare different treatments. This is illustrated on the left. Pictures of ‘Green salad bowl’ lettuce were taken throughout the production cycle to monitor the effect of different lighting treatments on canopy size. It is obvious that both high intensities of far-red and photosynthetic photon flux density (PPFD) increase canopy size.
The image is from:
Supplemental Far-Red Light Stimulates Lettuce Growth: Disentangling Morphological and Physiological Effects
by Reeve Legendre and Marc W. van Iersel
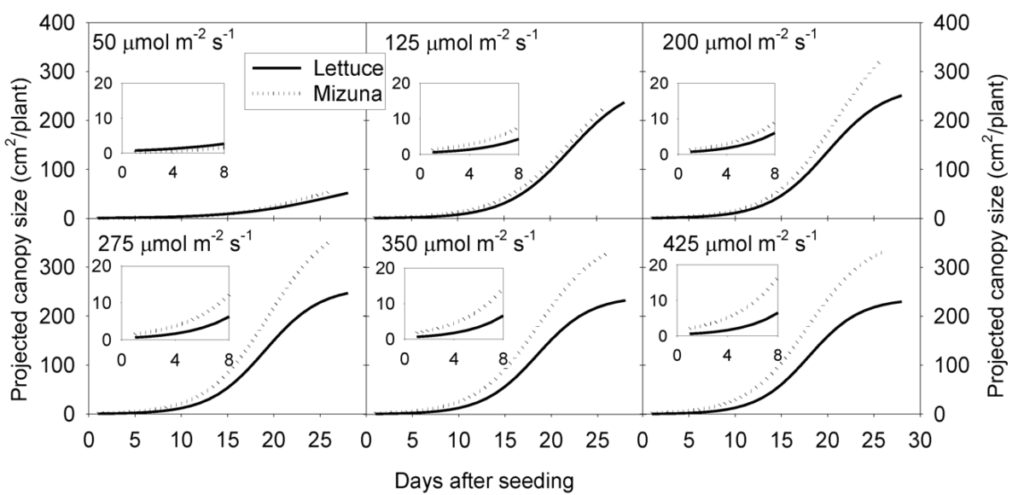
Once we know the project canopy size (a 2D projection of a 3D canopy) and we measure the PPFD, we can calculate the amount of light that reaches a plant or crop. We call this the ‘incident light’. The graph on the right shows how the projected canopy size of mizuna is affected by different PPFD levels and how it increases over the course of a growing cycle.
The graph is from:
Canopy Size and Light Use Efficiency Explain Growth Differences between Lettuce and Mizuna in Vertical Farms
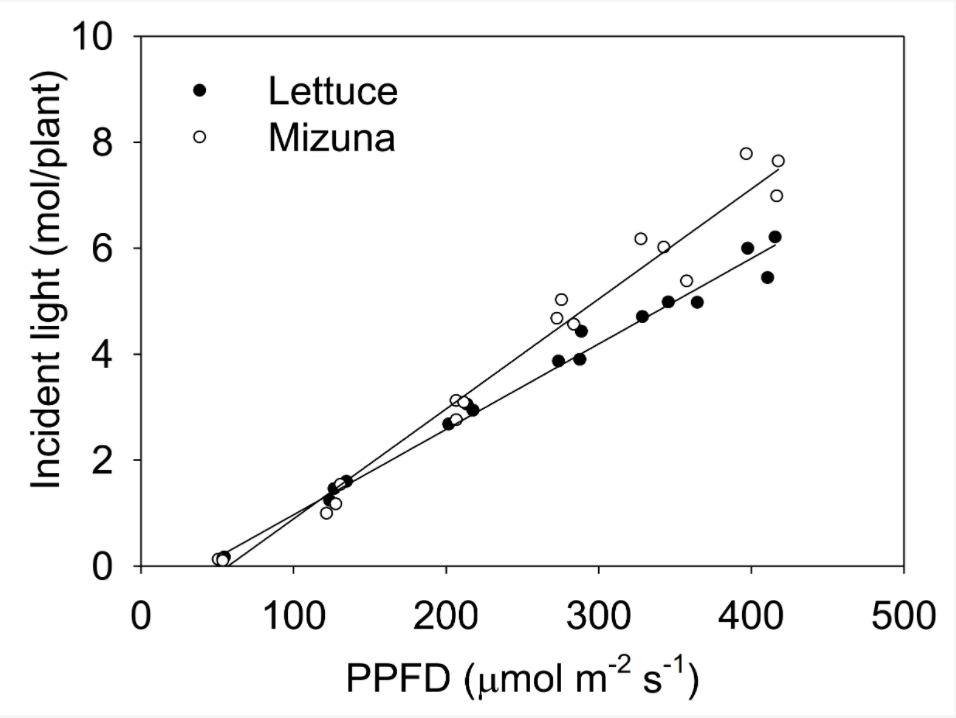
If we know the projected canopy size and have light data, it is simple to calculate the incident light. The graph on the left shows the total incident light over an entire growing cycle. At higher PPFDs, mizuna receives more light than lettuce, because it makes a larger canopy. That in turn helps the mizuna grow faster than lettuce. Few things matter more for growth than the amount of light received by a crop.
The graph is also from:
Canopy Size and Light Use Efficiency Explain Growth Differences between Lettuce and Mizuna in Vertical Farms
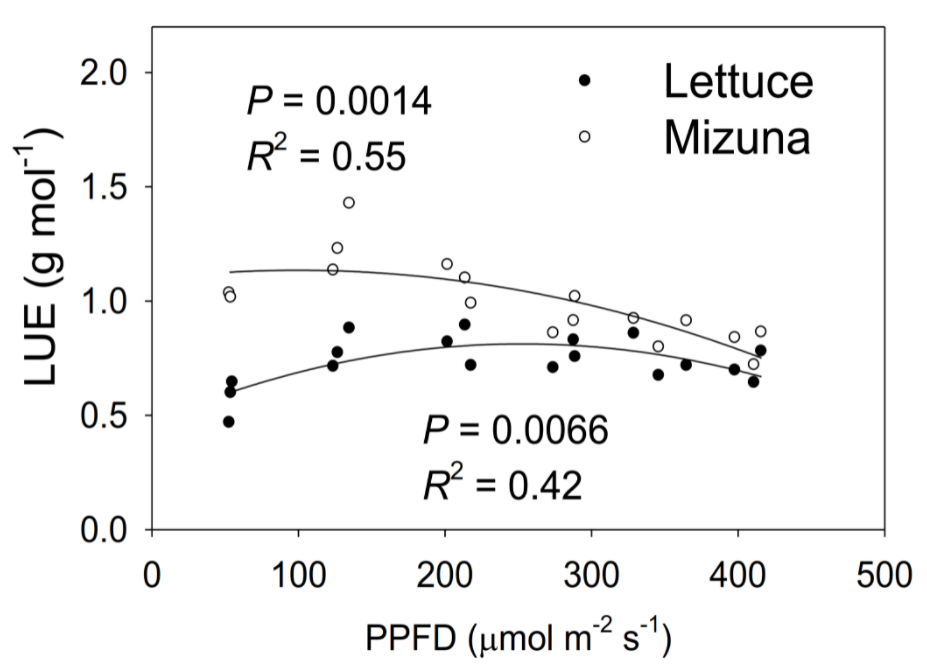
Once we have calculated the total incident light and weighed the biomass of the plants, we can calculate the light use efficiency, here shown as a function of PPFD during the growing cycle. Light use efficiency = biomass / incident light. The theoretical maximum for LUE is about 1 – 1.25 gram / mol of photons. Notice that mizuna gets very close to this theoretical maximum! Mizuna grwos fast, because it can use light very efficiently to produce biomass.
The graph is also from:
Canopy Size and Light Use Efficiency Explain Growth Differences between Lettuce and Mizuna in Vertical Farms
Chlorophyll fluorescence imaging for stress detection
Chlorophyll fluorescence measurements have long been used for detection of a wide range of stresses. But our simple imaging approach has not been used for this purpose. To determine whether this imaging has potential for stress detection, we took chlorophyll fluorescence images of plants treated with a soli application of atrazine. Atrazine inhibits electron transport through photosystem II and therefore would be expected to increase chlorophyll fluorescence. The images on the left conform this and clearly show the movement of atrazine through the New Guinea impatiens.
Image from:
Low-Cost Chlorophyll Fluorescence Imaging for Stress Detection
by Reeve Legendre 1,Nicholas T. Basinger 2 and Marc W. van Iersel 1
We have found several very useful applications of chlorophyll fluorescence imaging and are actively studying other applications, such as early disease or pest detection, or the impact of abiotic stresses. To be continued….
Multi-spectral imaging
has long been used in plant science, either as a ground-based application or in remote sensing. The term ‘multi-spectral simply refers to the fact that multiple pictures are taken, each under a different color of light.
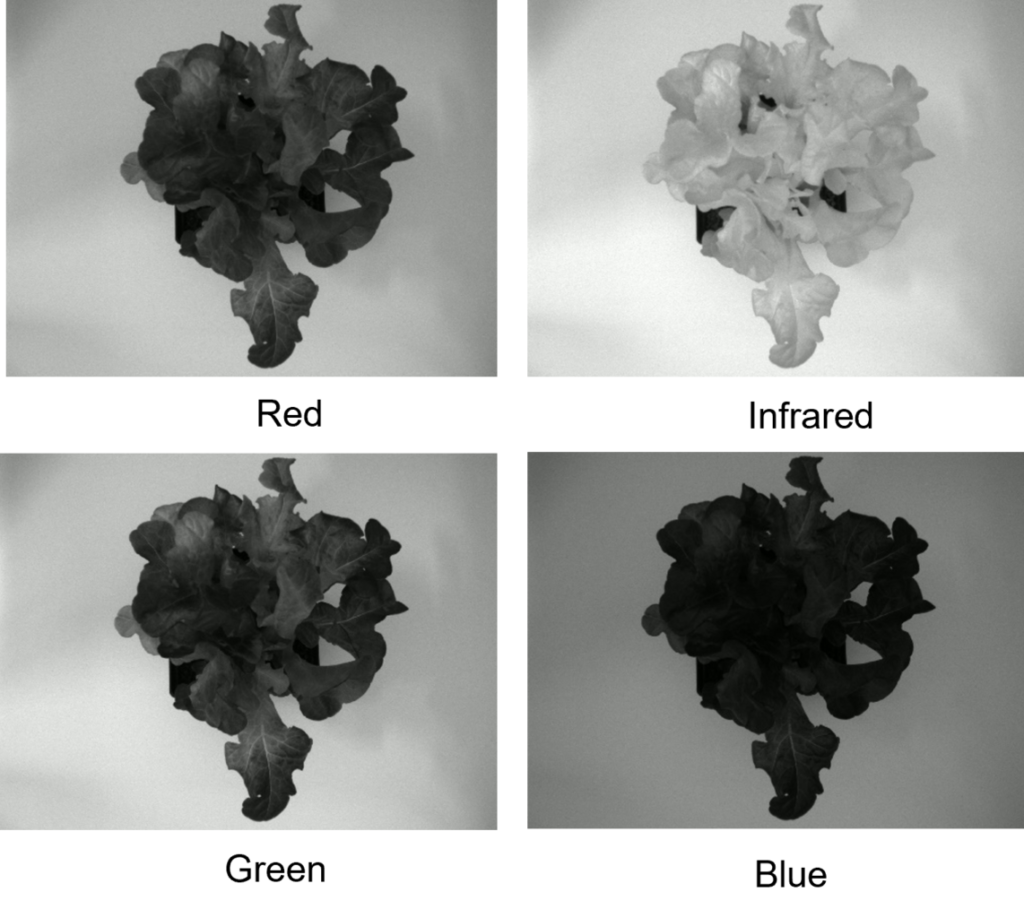
The pictures of the lettuce plant on the right show an example: pictures were taken under red, green, blue, and infra-red light. Each individual picture is a greyscale image, but the red, green, and blue images can actually be combined to create a color image.
Different wavelengths of light can provide different information. This becomes more powerful when images taken under different colors of light are combined, using a process referred to as ‘image math’. The concept is pretty simple: using the pixel intensity information for all the pixels in two matches images, you can substract each other or add images together.
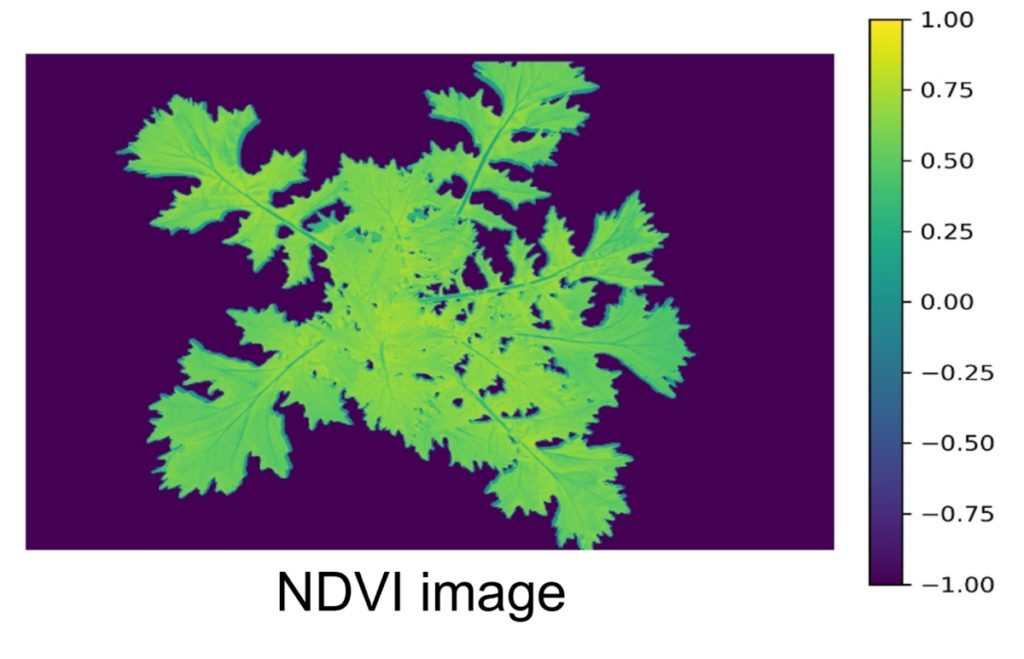
An example of using image math is shown on the left. This false color image of a mizuna plant was created using pictures taken under red and infra-red light. The Normalized Difference Vegetation Index was calculated as (infra-red – red)/ (infrared + red). This resulted in values ranging from about 0 to 1, here shown in false color. Note that the background is automatically ignored in our image processing and shown here in purple color.
NDVI imaging can be a useful tool in detecting nutrient deficiencies in plant and to quantify color.
Our research is supported by: